BarChart and LineChart
Purpose
Themed charts for comparing amounts and reading trends.
Signature
pub struct BarChart<Msg = crate::callback::Callback> { .. }

impl BarChart {
    pub fn new(data: impl IntoIterator<Item = (impl Into<String>, f32)>) -> Self;
}
pub struct LineChart<Msg = crate::callback::Callback> { .. }

impl LineChart {
    pub fn new(data: impl IntoIterator<Item = (impl Into<String>, f32)>) -> Self;
}
Example
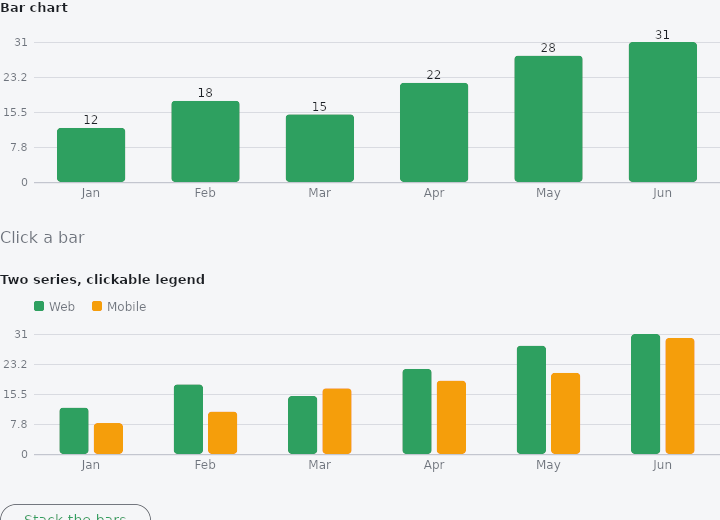
From frus-examples/widgets/src/features/display/widgets/chart.rs:
//! `BarChart` and `LineChart` — self-painted, themed views of a series of
//! `(label, value)` pairs: bars to compare amounts, a line to read a trend.

use frus::{BarChart, Color, LineChart, Text, Widget};

use crate::common::shared::{section, sections};

const MONTHS: [&str; 6] = ["Jan", "Feb", "Mar", "Apr", "May", "Jun"];
const WEB: [f32; 6] = [12.0, 18.0, 15.0, 22.0, 28.0, 31.0];
const MOBILE: [f32; 6] = [8.0, 11.0, 17.0, 19.0, 21.0, 30.0];

pub fn example() -> Box<dyn Widget> {
    Box::new(frus::component(|cx| {
        let picked = cx.use_state(|| None::<(usize, usize)>);
        let hidden = cx.use_state(Vec::<usize>::new);
        let stacked = cx.use_state(|| false);

        let series = || MONTHS.iter().copied().zip(WEB);
        let mobile_color = Color::hex("#F59E0B");

        // Clicking a bar reports `(category, series)`; `selected` rings the one the app
        // pinned. The chart fills the width it is given.
        let pick = picked.clone();
        let clickable = BarChart::new(series())
            .height(180.0)
            .grid(4)
            .on_point(move |category: usize, series: usize| pick.set(Some((category, series))))
            .selected(picked.get());
        let caption = match picked.get() {
            Some((category, _)) => format!("{}: {} visits", MONTHS[category], WEB[category]),
            None => "Click a bar".to_string(),
        };

        // Several series share one scale: grouped side by side, or stacked. A clickable
        // legend lets the reader hide one — the hidden list is the app's state.
        let toggle_series = hidden.clone();
        let flip = stacked.clone();
        let grouped = BarChart::new(series())
            .name("Web")
            .series("Mobile", mobile_color, MOBILE)
            .height(180.0)
            .grid(4)
            .legend(true)
            .stacked(stacked.get())
            .hidden(hidden.get())
            .on_legend(move |index: usize| {
                toggle_series.update(|hidden| {
                    if let Some(at) = hidden.iter().position(|&h| h == index) {
                        hidden.remove(at);
                    } else {
                        hidden.push(index);
                    }
                })
            });

        sections(vec![
            Box::new(section("Bar chart", clickable)),
            Box::new(Text::new(caption).color(cx.theme().muted)),
            Box::new(section("Two series, clickable legend", grouped)),
            Box::new(
                frus::Button::new(if stacked.get() {
                    "Group the bars"
                } else {
                    "Stack the bars"
                })
                .variant(frus::Variant::Outlined)
                .on_press(move || flip.update(|s| *s = !*s)),
            ),
            // The same data as a trend line; `area` fills under it.
            Box::new(section(
                "Line chart",
                LineChart::new(series()).height(160.0).grid(4).area(true),
            )),
            Box::new(section(
                "Two lines",
                LineChart::new(series())
                    .name("Web")
                    .series("Mobile", mobile_color, MOBILE)
                    .height(160.0)
                    .grid(4)
                    .legend(true),
            )),
        ])
    }))
}
Properties
| Type | Method | Argument | Effect |
|---|---|---|---|
BarChart | .color() | color: Color | Overrides the colour of the bars (default: the theme's primary). |
BarChart | .height() | height: f32 | Height of the chart in logical pixels (200 by default). |
BarChart | .grid() | divisions: usize | Adds a y-axis: divisions horizontal grid lines with their ticks (0..max) in a left margin. 0 (the default) = no axis. |
BarChart | .name() | name: impl Into<String> | Names the main series (displayed in the legend). |
BarChart | .series() | name: impl Into<String>, color: Color, values: impl IntoIterator<Item = f32> | Adds an extra series (name, colour, values), drawn as bars grouped side by side within each category. Every series shares the scale and the axis. |
BarChart | .legend() | legend: bool | Shows a legend (colour swatch + name) for each series. Off by default. |
BarChart | .hidden() | indices: impl IntoIterator<Item = usize> | Hides the series at the given indices (not drawn, dimmed in the legend) — milestone 215. |
BarChart | .on_legend() | on_legend: impl Fn(usize) -> R + 'static | Makes the legend clickable: on_legend(index) on a click on an entry — milestone 215. |
BarChart | .stacked() | stacked: bool | Stacks the series: one bar per category, segmented by series (cumulative bars), instead of bars grouped side by side (milestone 212). Off by default. |
BarChart | .on_point() | on_point: impl Fn(usize, usize) -> R + 'static | Makes the bars clickable: on_point(category, series) on a click on a visible bar (or stacked stratum). None by default — milestone 222. |
BarChart | .selected() | selected: Option<(usize, usize)> | Pins a bar/stratum (category, series): it gets a persistent accent ring (highlighting the current selection, as a clicked detail). None = nothing — milestone 223. |
BarChart | .normalized() | normalized: bool | Normalises the stacking to 100%: each column fills the whole height, each stratum taking its share of the category's total (rather than its absolute value). Only has an effect in multi-series stacked mode. Off by default — milestone 224. |
LineChart | .color() | color: Color | Overrides the colour of the stroke (default: the theme's primary). |
LineChart | .height() | height: f32 | Height of the chart in logical pixels (200 by default). |
LineChart | .grid() | divisions: usize | Adds a y-axis: divisions horizontal grid lines with their ticks (0..max) in a left margin. 0 (the default) = no axis. |
LineChart | .area() | fill: bool | Fills the area under the curve (the stroke's colour heavily dimmed), to emphasise the volume rather than the trend alone. Off by default. |
LineChart | .name() | name: impl Into<String> | Names the main series (displayed in the legend). |
LineChart | .series() | name: impl Into<String>, color: Color, values: impl IntoIterator<Item = f32> | Adds an extra series (name, colour, values), aligned by index onto the main series' categories. Every series shares the scale and the axis. |
LineChart | .legend() | legend: bool | Shows a legend (colour swatch + name) for each named series. Off by default. |
LineChart | .stacked() | stacked: bool | Stacks the series: each area is cumulated above the previous ones (cumulative areas), so a total and its composition can be read. Implies filling the bands. Off by default. |
LineChart | .hidden() | indices: impl IntoIterator<Item = usize> | Hides the series at the given indices (not drawn, dimmed in the legend) — milestone 215. |
LineChart | .on_legend() | on_legend: impl Fn(usize) -> R + 'static | Makes the legend clickable: on_legend(index) on a click on an entry — milestone 215. |
LineChart | .animated() | animated: bool | Animates a pulsing halo (growing then fading) on the hovered point. Asks for a continuous repaint for as long as the chart is displayed. Off by default — milestone 217. |
LineChart | .on_point() | on_point: impl Fn(usize, usize) -> R + 'static | Makes the points clickable: on_point(category, series) on a click near a marker (of the visible series). None by default — milestone 221. |
LineChart | .selected() | selected: Option<(usize, usize)> | Pins a point (category, series): it gets a persistent halo + accent ring (highlighting the current selection, as a clicked detail). None = nothing — milestone 223. |
LineChart | .normalized() | normalized: bool | Normalises the stacking to 100%: each category fills the whole height, each stratum taking its share of the total. Only has an effect on multi-series stacked areas. Off by default — milestone 224. |
Behaviour
BarChart
A bar chart.
use frus_widgets::BarChart;
let chart: BarChart = BarChart::new([("Mon", 3.0), ("Tue", 5.0), ("Wed", 2.0)]).height(160.0);
LineChart
A line chart: the same (label, value) series as a BarChart, but joined into a polyline (segments + markers) so that a trend can be read.
use frus_widgets::LineChart;
let chart: LineChart = LineChart::new([("Mon", 3.0), ("Tue", 5.0), ("Wed", 2.0)]).height(160.0);
See also
- DataTable: a table that sorts, searches, pages and selects its rows for you.
- Table: a controlled grid of text or widget cells; the app sorts and selects.
- Timeline: a vertical chronology of events joined by a line.
- Tree: a hierarchy of rows that expand, collapse and select.
- Breadcrumb: the trail from the top of a hierarchy to the current page.
- The guide: Text, colour and the theme
- API reference:
BarChart - API reference:
LineChart
Source: crates/frus-widgets/src/chart.rs, crates/frus-widgets/src/chart.rs @ e6fba33f5b42